
Interface
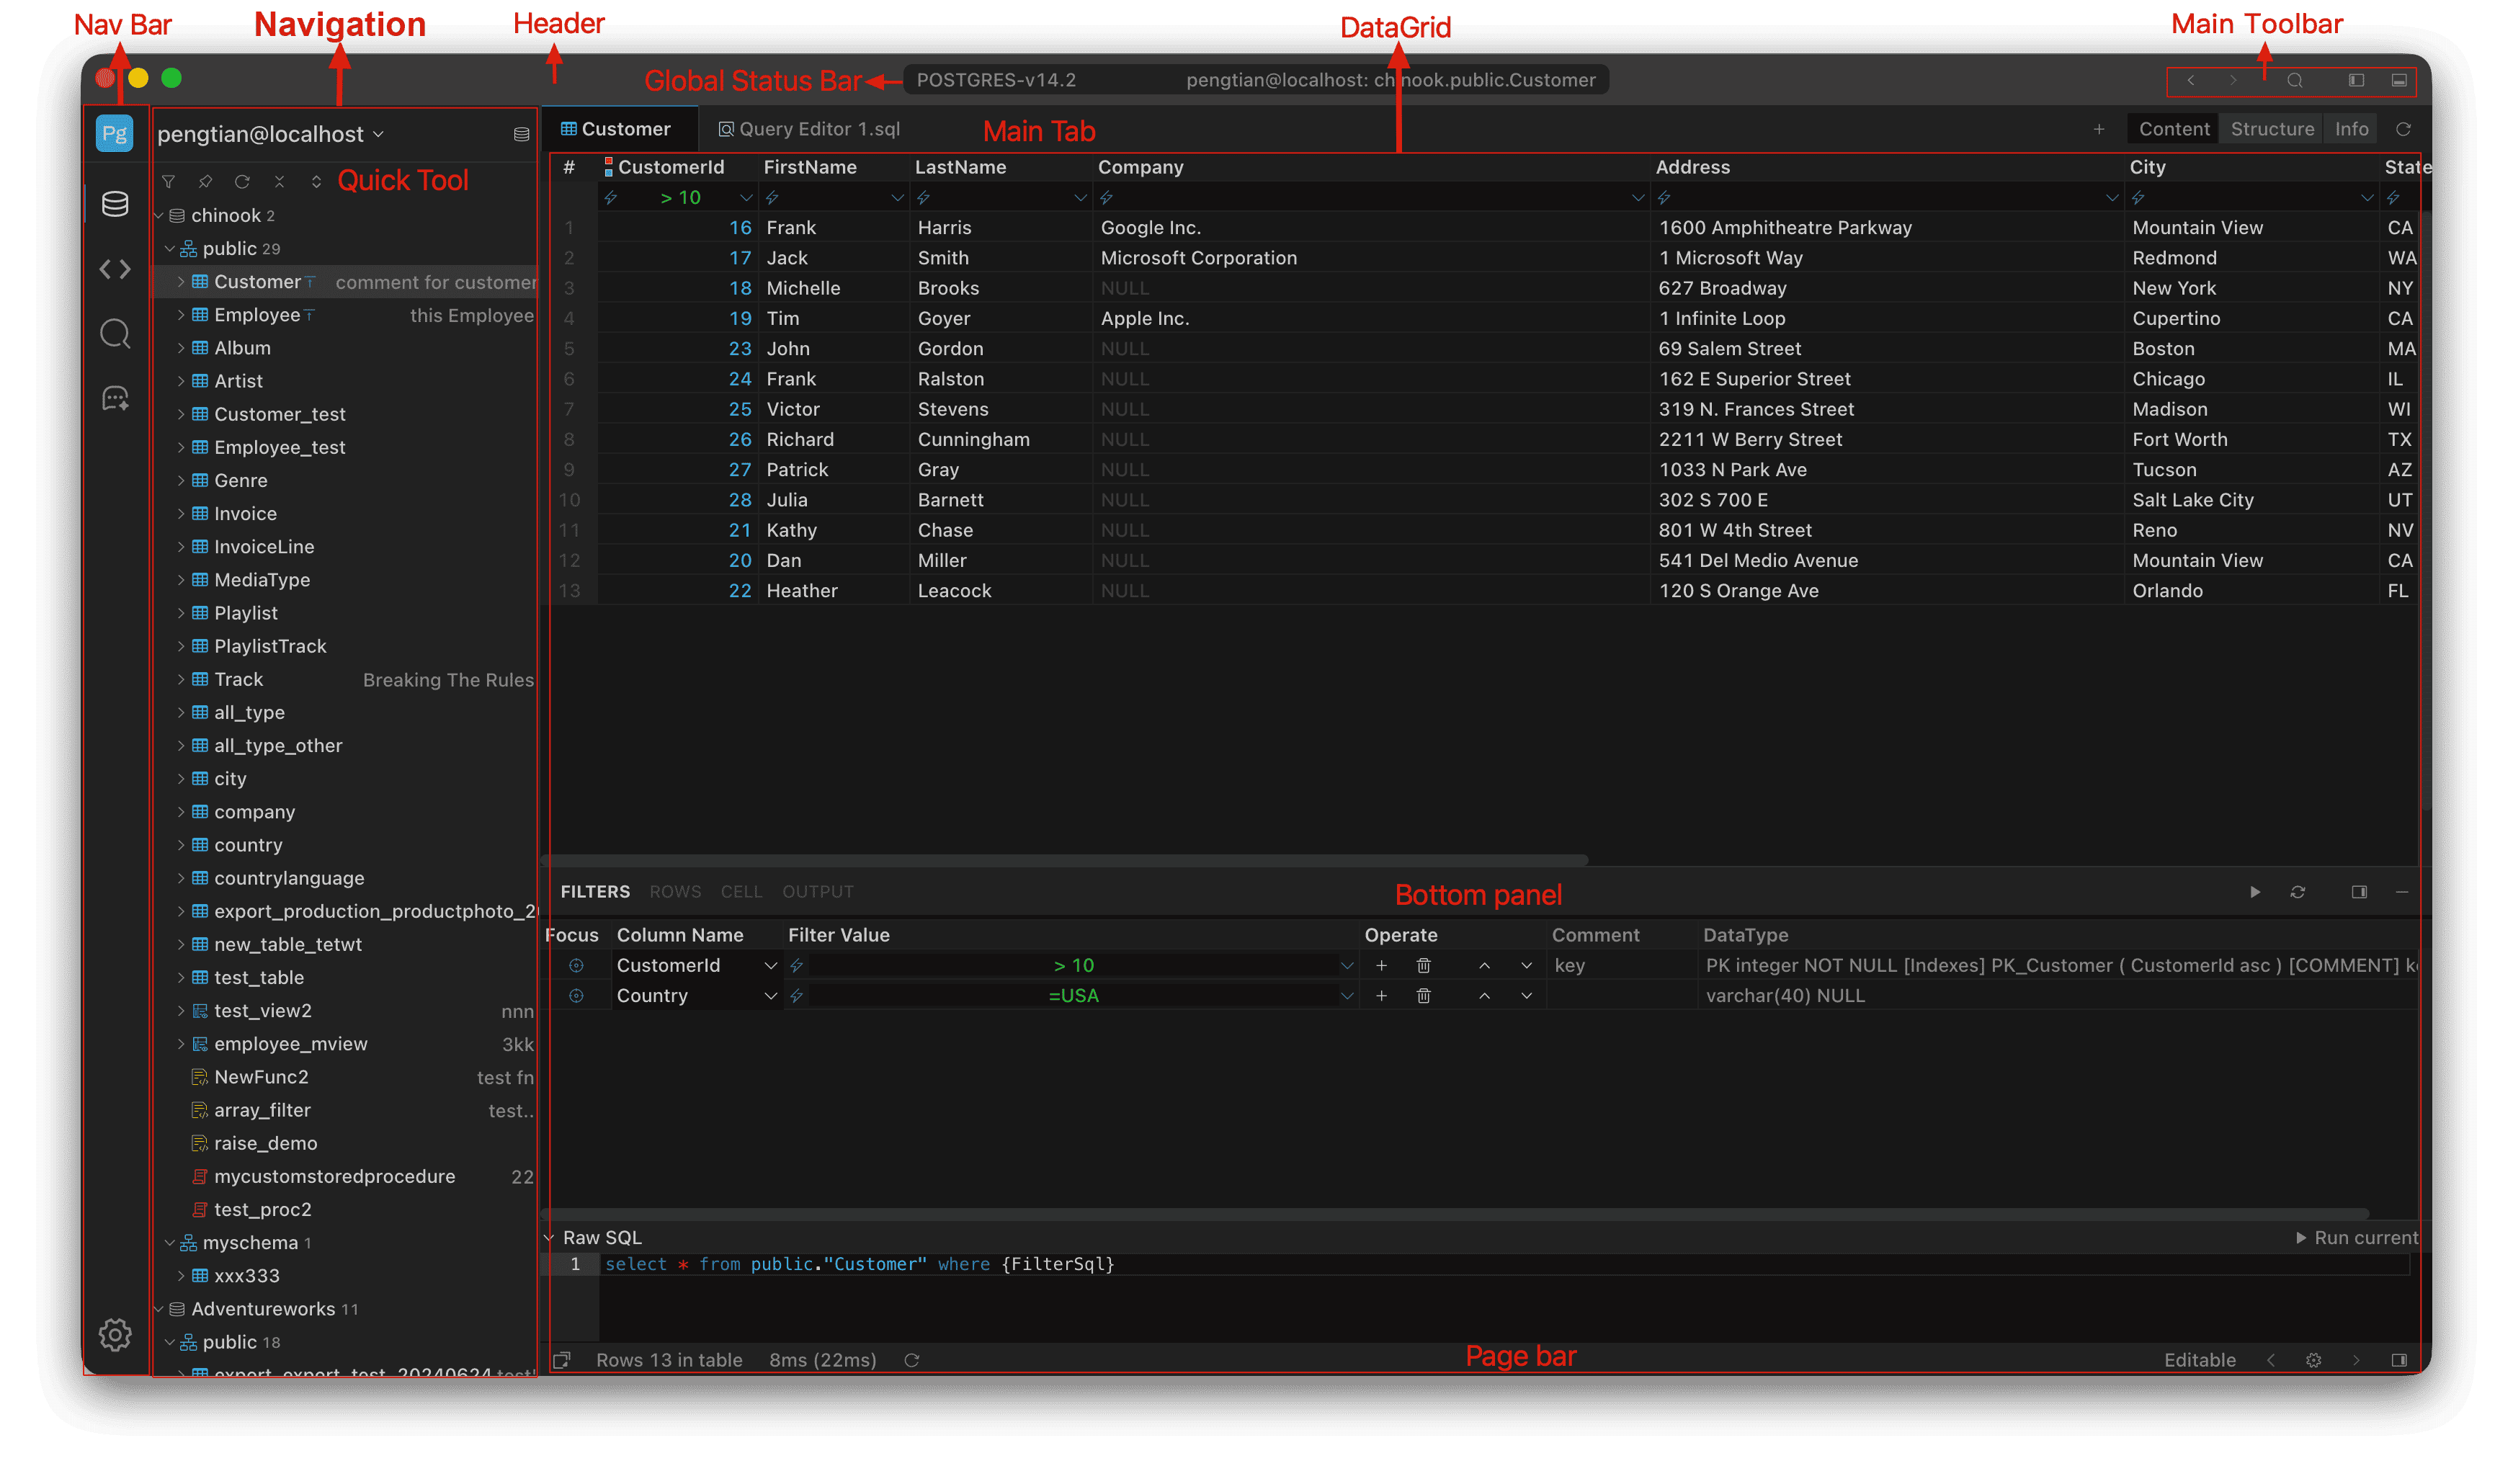
Main window regions: red labels mark each region, arrows point to their locations
SteelSQL keeps everything in one window, split into ten regions. Each region is described below in the order labeled in the figure.
Nav Bar
The vertical icon strip at the far left, used to switch the left panel:
| Icon | Panel it opens |
|---|---|
| Database | Object tree (tables, views, functions, and so on) |
<> | Query file panel |
| Magnifier | Search |
| AI | AI assistant |
Only one panel is open at a time; the highlighted icon marks the active panel.
Navigation
The object panel to the right of the Nav Bar, used to browse the databases, schemas, and objects of the current connection.
- The top is the connection row; click the connection name to switch workspaces.
- Below it are Quick Tool and the object tree.
- The tree loads on demand: a level is queried only when expanded.
See Navigation for details.
Quick Tool
The row of small icons at the top of Navigation, acting on the current tree:
| Icon | Action |
|---|---|
| Funnel | Show or hide the filter box |
| Pin | Show or hide the pinned panel |
| Circular arrow | Reload objects (Cmd+R) |
| × | Clear the filter conditions |
| ⌃⌄ | Collapse all or expand all |
Header
The strip at the very top of the window, containing the window controls, the Global Status Bar, and the Main Toolbar. Drag this strip to move the window.
Global Status Bar
The status text in the middle of the Header, showing global information about the current connection, for example:
POSTGRES-v14.2 pengtian@localhost: chinook.public.CustomerIn order: dialect and version, connection name, database / schema / current object. It changes as you switch tabs.
Main Toolbar
Global buttons on the right of the Header, independent of any particular database object:
- Forward / Back: move through history
- Search
- Layout / view switching
- Window controls (minimize, maximize, close)
Main Tab
The tab bar at the top of the content area, holding open tables and query files:
- Each tab is one table or one SQL file.
- At the right end of the tab bar are the Content / Structure / Info view switcher and refresh, acting on the current table.
- Click
+to create a new tab.
See Content and Query Nav for details.
DataGrid
The data area in the middle; everything from the column headers down is the DataGrid:
- The filter row below the column headers
- Data rows, editable in place
- Edits are highlighted and are not written to the database until committed
For detailed DataGrid operations, see Content.
Bottom panel
The panel below the data area, with four tabs:
| Tab | Contents |
|---|---|
| FILTERS | Filter conditions list and Raw SQL |
| ROWS | View and compare data row by row |
| CELL | Value and binary preview of the current cell |
| OUTPUT | Execution log, errors, and duration |
Page bar
The strip at the very bottom of the window, showing statistics and paging for the current result:
- Row count and two timings, for example
Rows 13 in table 8ms (22ms): the value before the parentheses is Query Time (from sending the request to receiving column metadata), and the value inside is duration Time (the whole load through rendering). Length/Selected/Row x,Col y: length of the selection, number of cells, and cursor positionEditable/Read Only: whether the current result is editable- Left and right arrows page through results